Analysis Wall
NOAA Advisories Map - Click for DETAIL!
Legend
West Infared Satellite
East Infared Satellite
West Vapor Satellite
East Vapor Satellite
Visible
GeoColor
Water Vapor
Infrared
US Surface Map
Radar Loop
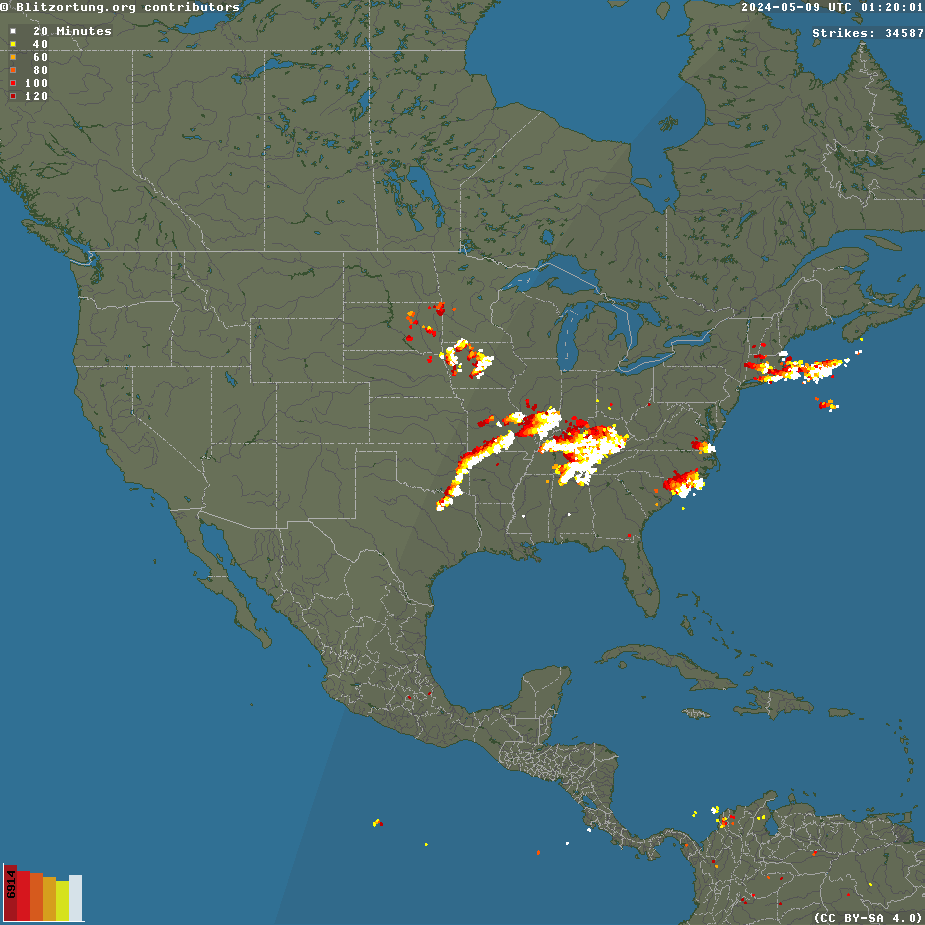
North America Lightning
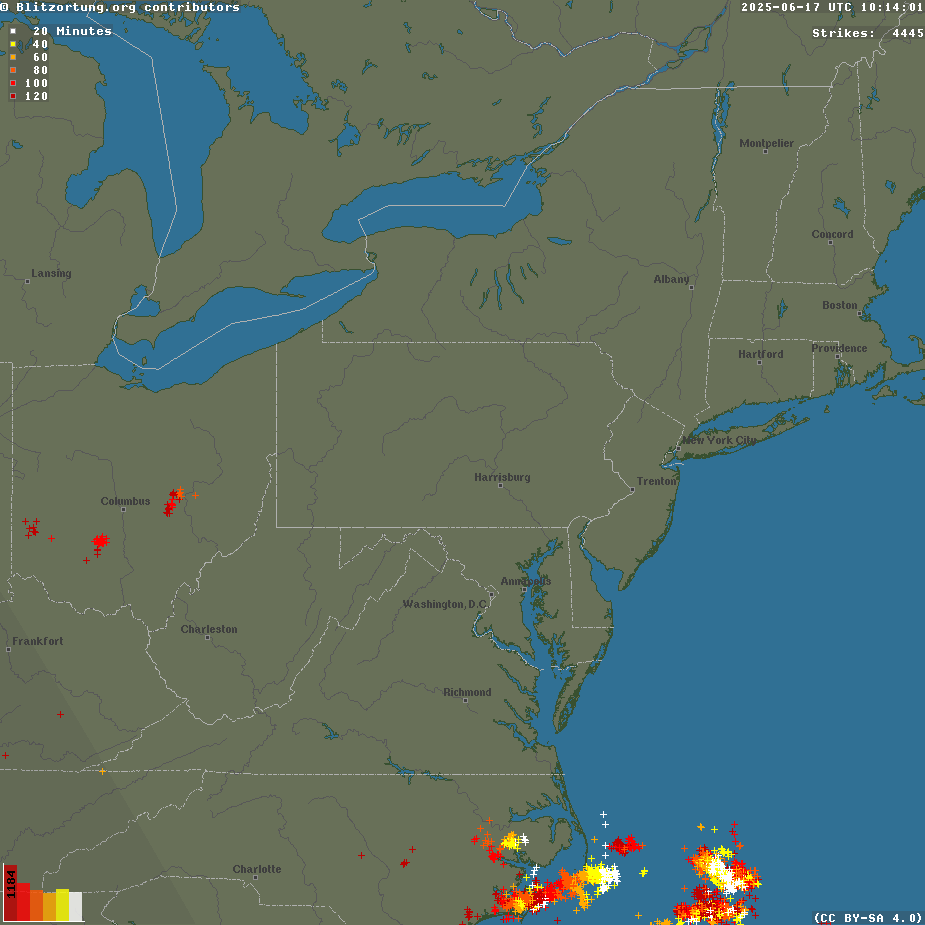
North East Lightning
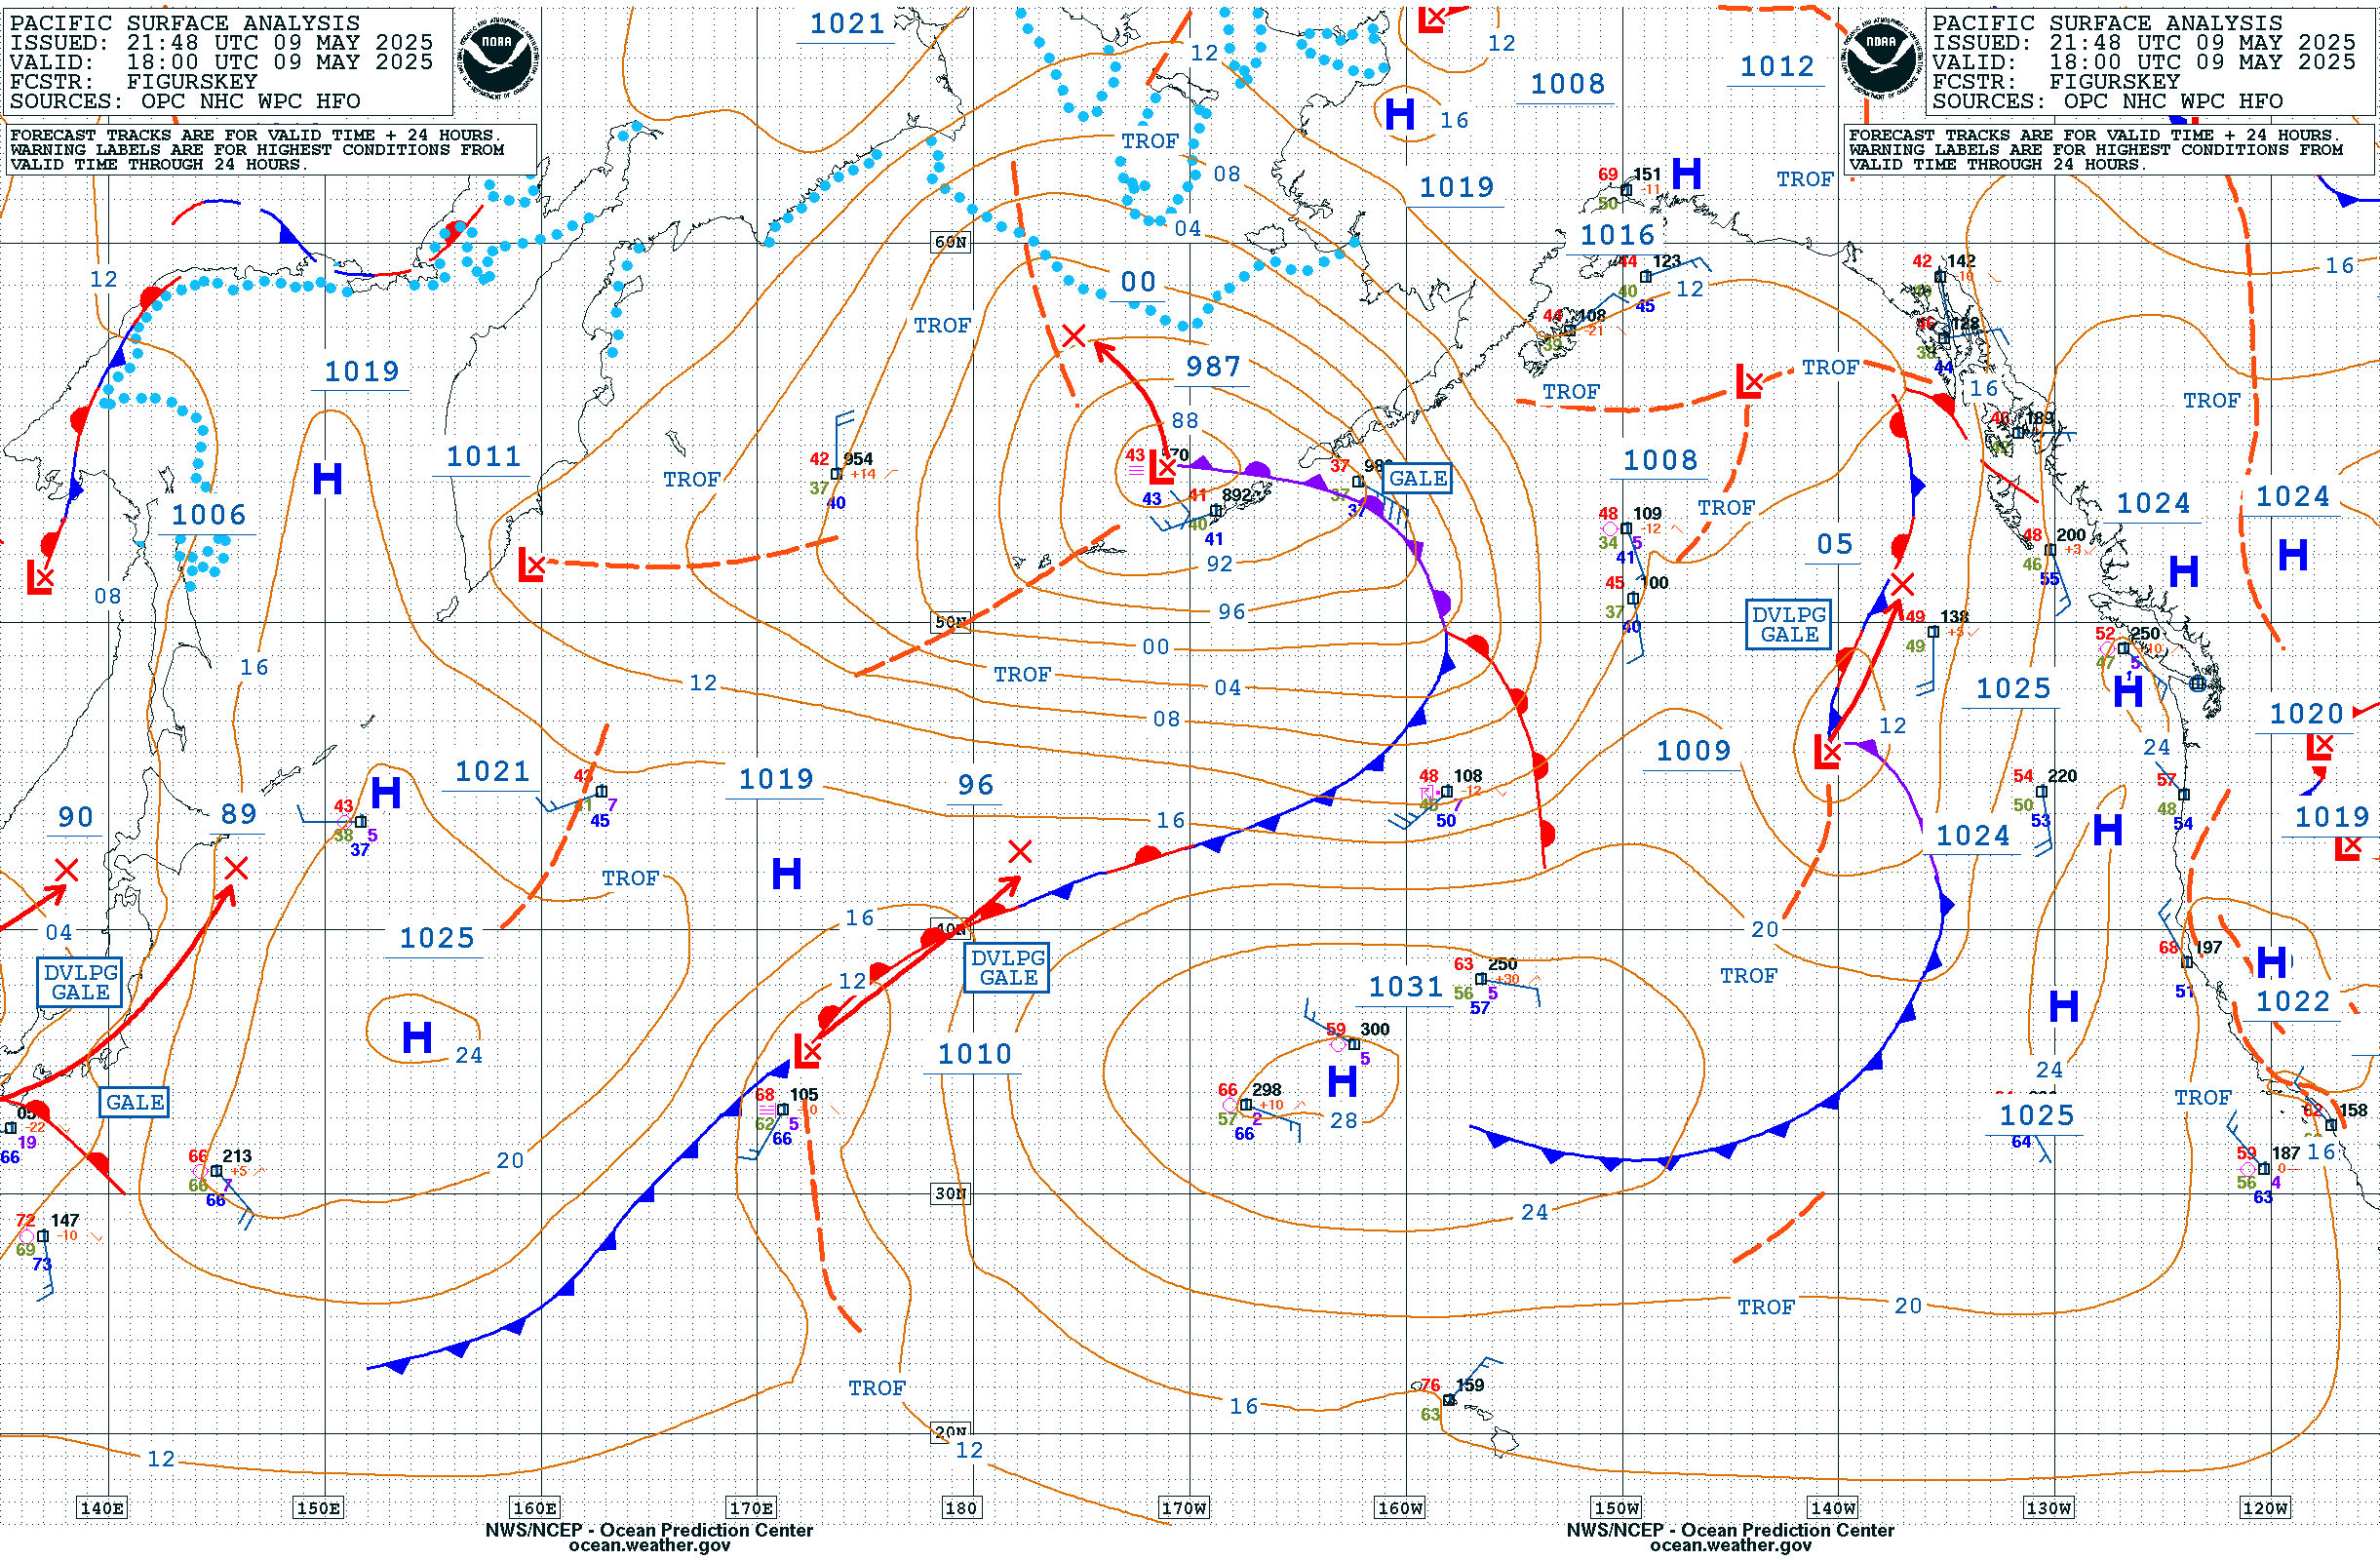
Pacific Surface Map
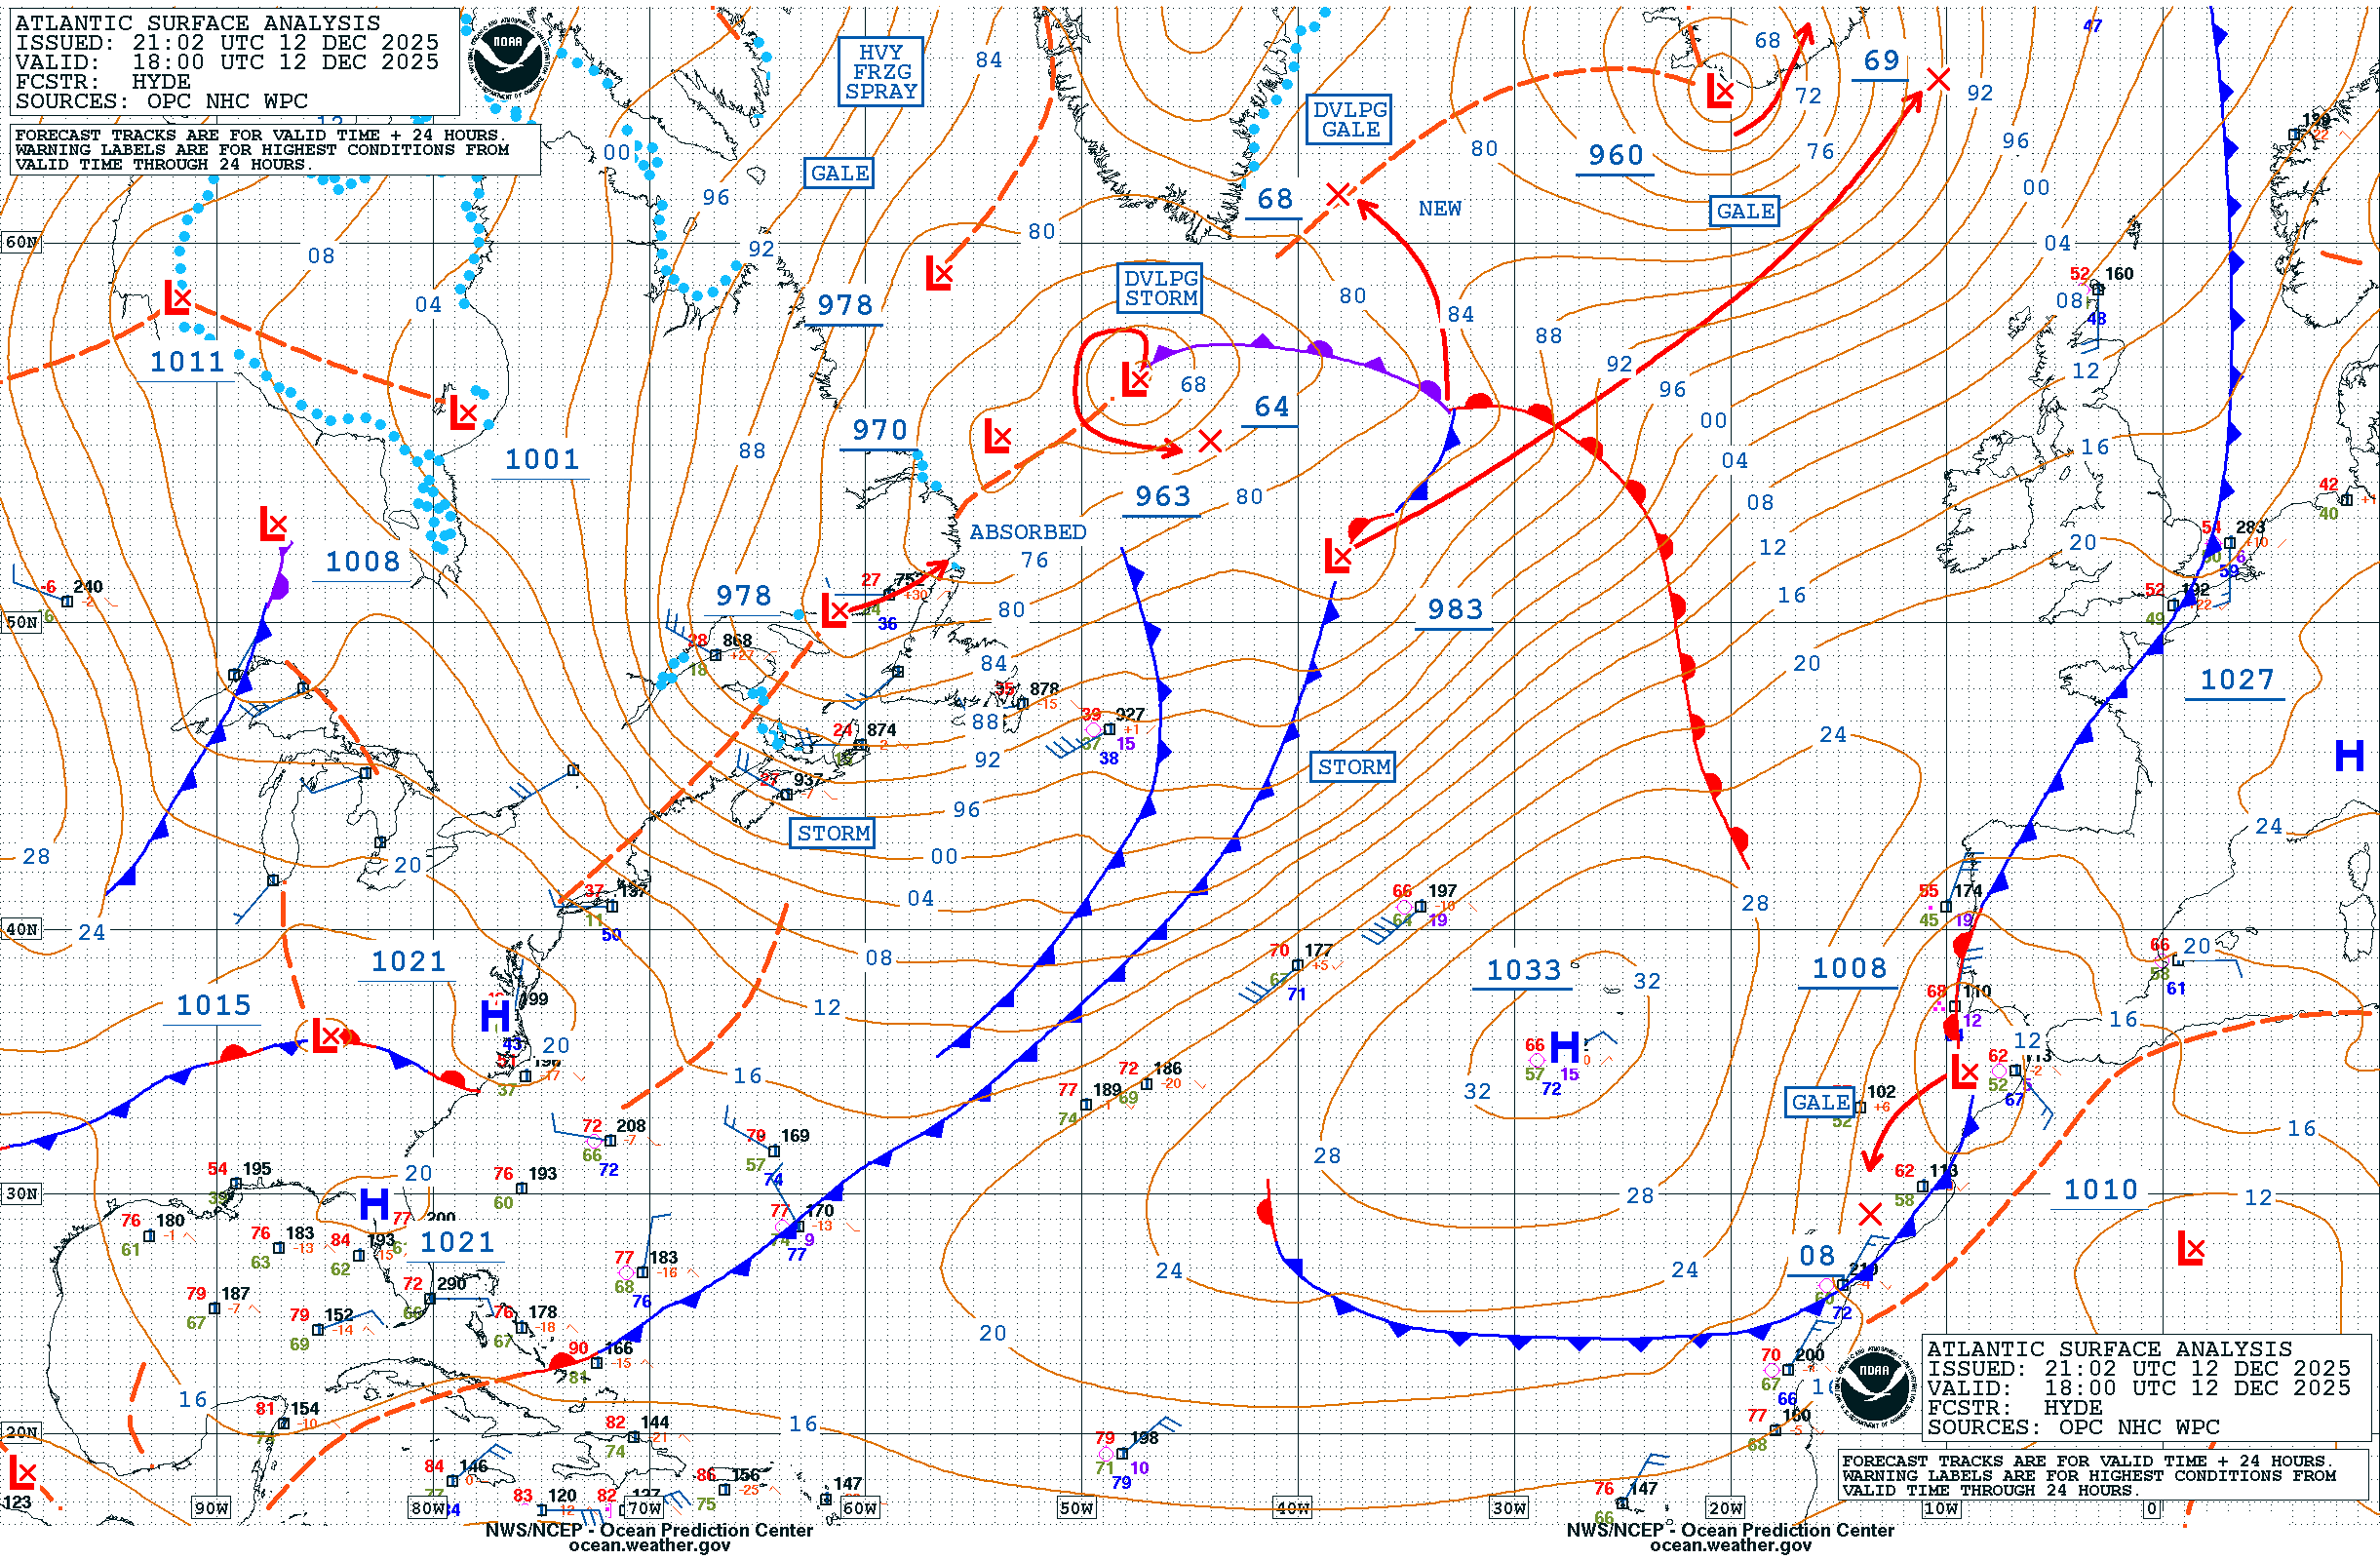
Atlantic Surface Map
North America Temperature
North America Dewpoint
United States Temperature
United States Feels Like
6hr Temperature Change
24hr Temperature Change
6hr 850MB Temperature Change
24hr 850MB Temperature Change
Dewpoint
Humidity
24hr Dewpoint Change
24hr Relative Humidity Change
Wind Chill
Heat Index
7 Day Temperature Trend
30 Day Temperature Trend
7 Day Precipitation Trend
30 Day Precipitation Trend
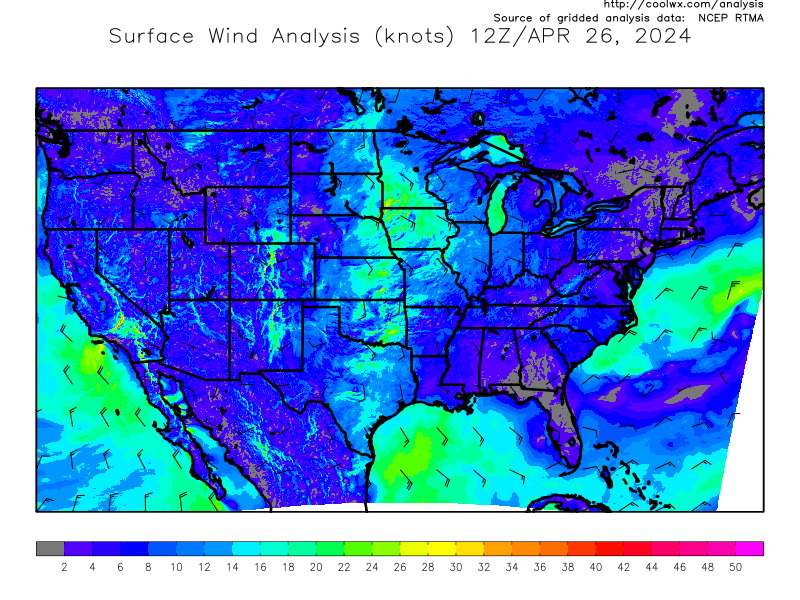
Wind Knots
Wind MPH
Wind Max Sustained 24hr
Wind Max Gusting 24hr
30mb Stratosphere
150mb Troposphere
Stratosphere
Troposphere
Western 300mb
Eastern 300mb
Western 500MB Vorticity
Eastern 500MB Vorticity
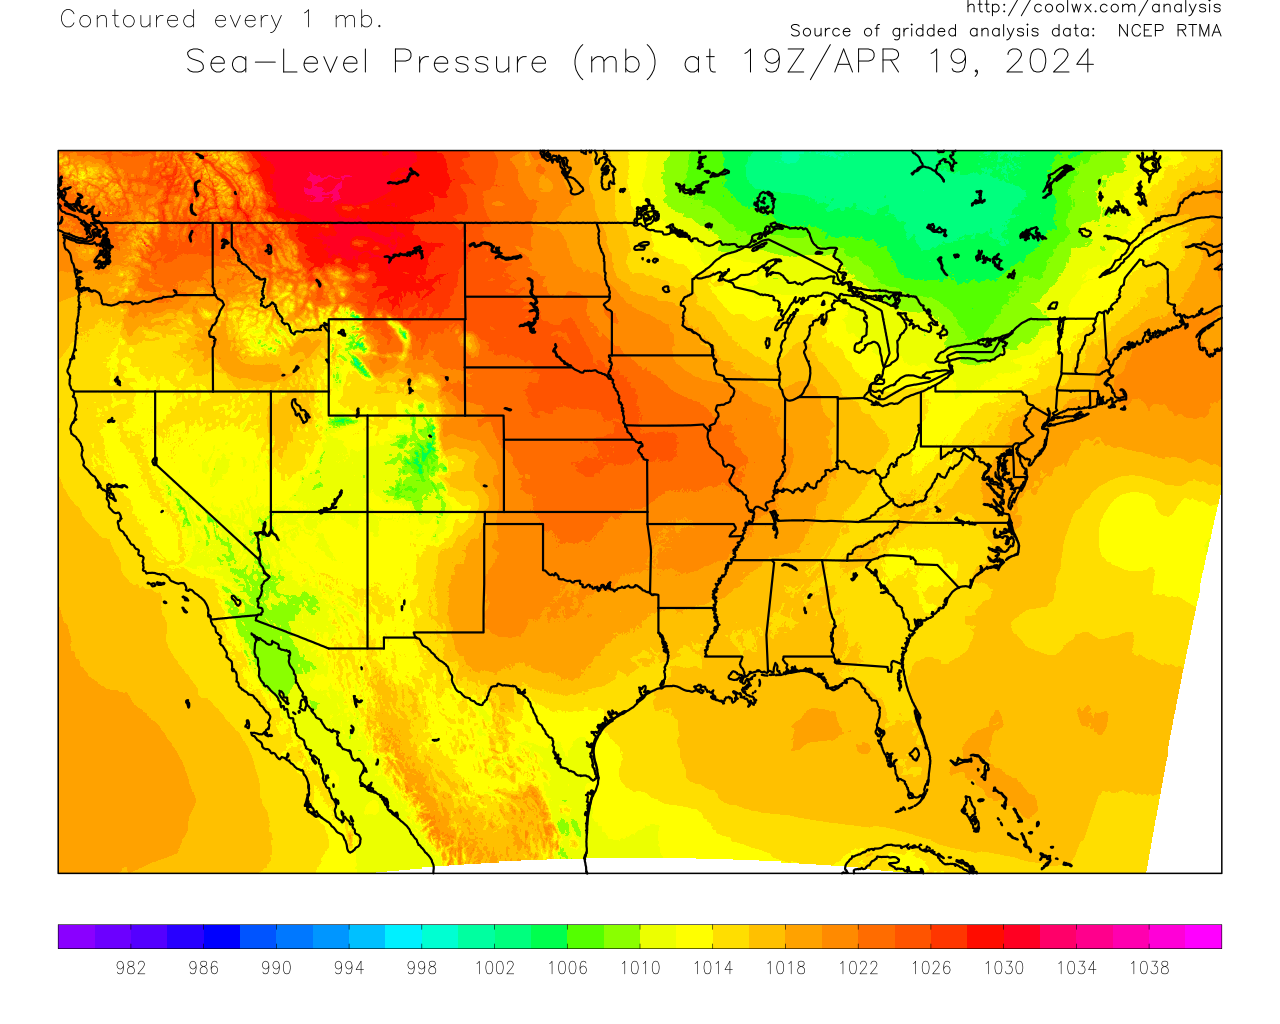
Pressure
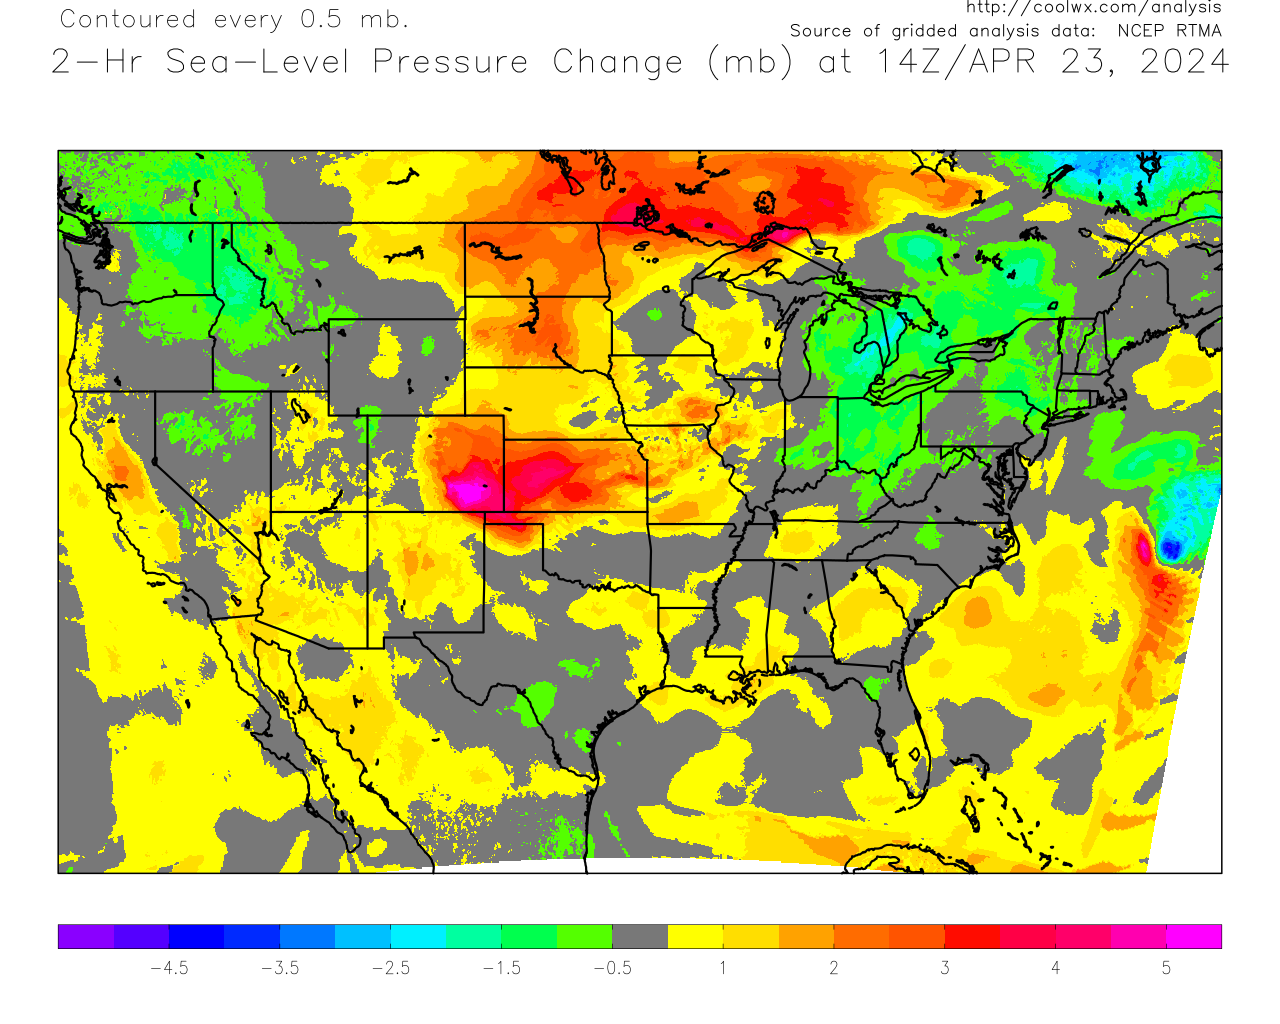
2 Hour Tendency
Pressure Tendency 6 Hour
Pressure Tendency 24 Hour